Doing Business 2015 – Going Beyond Efficiency
is a flagship report from the World Bank Group based in Washington DC. This global thematic report measures business
regulations whether they enhance or constrain business activity in 189 economies
around the world (download report here).
Government with an efficient
bureaucracy plays a critical role in providing a right environment where
individuals and businesses will thrive.
Too much regulation is a recipe for economic stagnation whereas too
little regulation can lead to economic disaster (remember the Great Recession?).
In
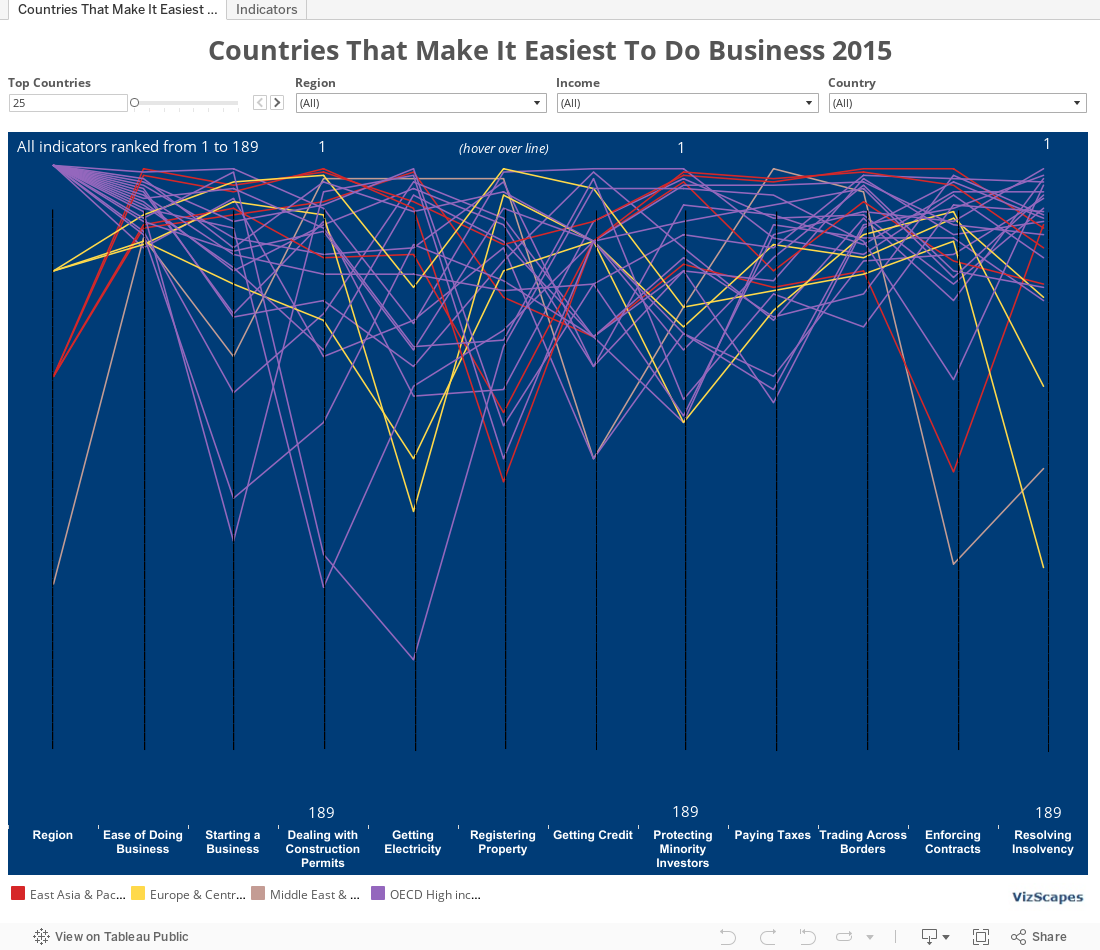
this report , the countries are ranked by the Ease of Doing Business
score, which is a composite of the
following 10 indicators: 1)
Starting a business, 2) Dealing with construction permits, 3) Getting electricity, 4) Registering property, 5) Trading across borders, 6)
Getting credit, 7) Protecting minority investors, 8) Enforcing contracts, 9) Resolving insolvency, & 10) Labor market regulation.
Parallel
coordinates were used to visualize this multi-dimensional data. The best way to utilize this visualization is
to filter the data by region, income, or country. Otherwise if all 189 countries were displayed,
the chart would become a colorful abstract visualization with too much
information!
The
top 3 economies that make it easiest to do business in 2015 are Singapore, New
Zealand, and Hong Kong, ranked 1, 2, and 3, respectively. Now go ahead and compare countries of your
choice to see which nation is more business-friendly so that you can open your
oversea office or start your business there!
The inspiration for this post came from this intricate
Scattering Points in Parallel Coordinates (SPPC) design from Peking University. One look and I was immediately captivated by its
sophisticated complexity. Joe Mako has
also visualized similar multidimensional data with parallel coordinates chart using Tableau.
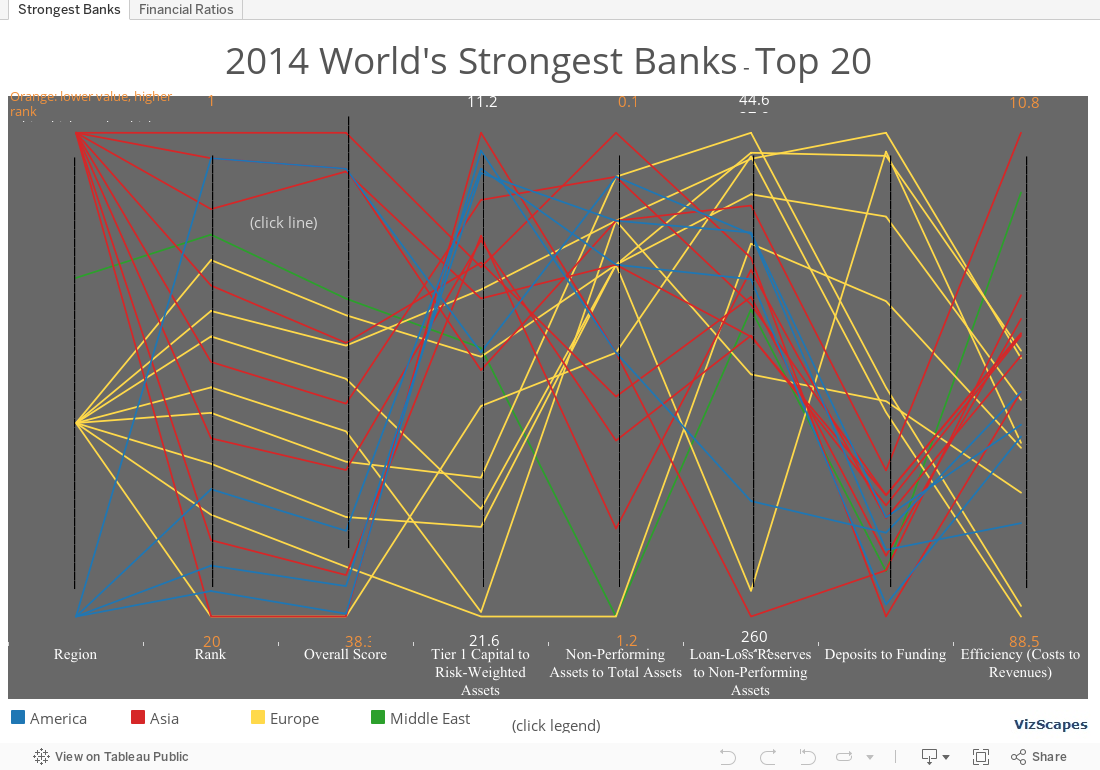
For this visualization of the world's strongest banks, 8 dimensions were used to form
parallel coordinates. For dimensions Overall
Score, Non-Performing Assets to Total Assets, and Efficiency (Costs to
Revenues), the lower the value, the higher the ranking. Whereas for dimensions Tier 1 Capital ratio,
Loan-Loss Reserves to Non-Performing Assets, and Deposits to Funding, the
higher the value, the higher the ranking.
Let’s interpret the chart (this
visualization would benefit more with a larger data population but Bloomberg Markets only released top 20
out of 97 banks ranked). Asian and
European banks account for about 40% each of the top 20 banks, and North
American banks, 20%. In general, Asian
and European banks rank higher than North American banks. The top ranking is
Hang Seng bank from Hong Kong, followed by Desjardins Group from Canada and
Norinchukin Bank from Japan, both tied at rank #2.
For Tier 1 Capital Ratio,
European banks generally have higher ratio, which means they are relatively more
well-capitalized than Asian and North American banks.
For Deposits to Funding, European
banks have lower ratio, which means they tend to lend more and are less liquid
than Asian and American banks. On
another hand, Asian and American banks have higher ratio, which means they lend
less and are more liquid. This might also
mean that Asian and American banks might not earn as much as they can compared
to European banks.
For Costs to Revenues
ratio, Asian banks have lower ratio, which means that they are run more
efficiently than European and American banks.