I was happy
to come across “The Future of Technology, Media & Telecoms” report from CM Research in London. This trend forecast report
provides in-depth global thematic research in the Technology, Media and
Telecoms sectors convergence. It’s a
fascinating read into the competitive battle among high-tech companies for
global supremacy.
I thought
this report can benefit from network analysis and proceeded to do so, using the
‘Build Network Graphs in Tableau’ guest post by Michael Martin as reference. I didn’t make good progress so I consulted with
Valdis Krebs, the leading expert in social network analysis at Orgnet, LLC, who
informed me that Tableau is good for standard statistics (independent
variables), but not designed for relational statistics (interdependent variables)
on a large scale. Instead, he graciously
designed the Network Analysis graph and the Behavior graph using Orgnet’s
proprietary application.
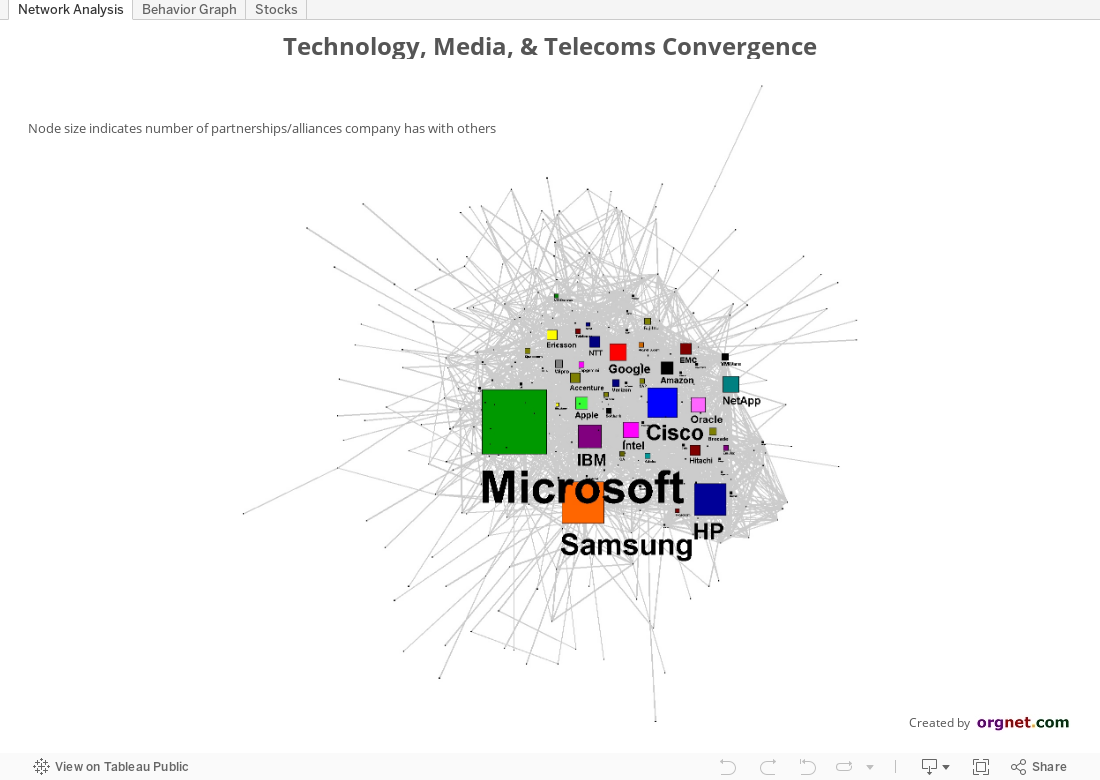
The Network
Analysis graph shows relationship among companies, with the node size indicates
number of partnerships/alliances a company has formed with others. The top 2 companies that have the most number
of alliances are Microsoft and Samsung.
Surprisingly, Apple, the company with the biggest market value of $600
billion, doesn’t have as many alliances as its rival Samsung, maybe because Apple
prefers to form a tight circle of trusted partnerships. Large successful Internet companies such as
Google and Amazon also don’t have as many alliances, perhaps because they’re
still relatively young or because they’re pioneers in their own paths.
For an even deeper analysis, we look into a behavior
graph. Accordingly to Valdis Krebs, “Two
companies are connected if they have chosen a similar set of partners.
Now, since partners usually bring new knowledge, technology and ability
to a situation, we don’t want to be linked to our competitors in this map -- we
lose advantage because we are accessing the same resources and knowledge.
In fact in this behavior graph, we want to have as few links as possible
-- we do not want to be following a similar strategy that many others are.
So, the companies that have a lot of connections to each other,
especially if they are competitors, are all constraining each other's ability
to innovate and compete -- you can not be different and better if all of you
are competing on the same knowledge and abilities. Notice key industry
players like Apple, Google, Microsoft, Facebook, AT&T, and Amazon do not
have many companies with similar partner patterns. They each are planning
a unique ecosystem to compete from.”
In the
‘Stocks’ tab is the bar chart for the cumulative 5 ½ years stock price
performance from January 2009 to June 2014.
This chart is similar to the one in the “The Future of Technology, Media
& Telecoms” report, but now it has a filter for different categories (look
at Netflix in Infrastructure Software & Cloud category!).
This
visualization was created with the permission of Cyrus Mewawalla, Director of
CM Research, and with the contribution of Valdis Krebs, Founder of Orgnet, LLC.. I’m grateful to both for their generosity.