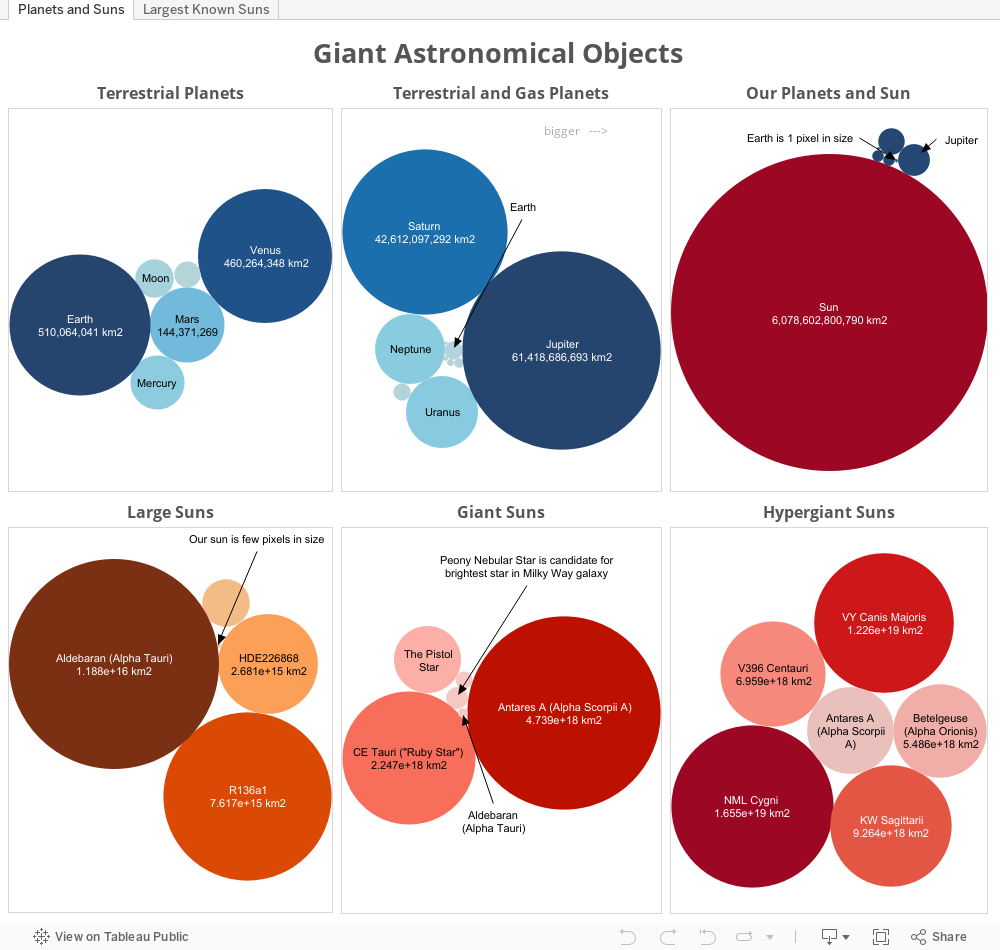
Giant Astronomical Objects
Building this viz about comparing giant astronomical objects
was a blast. I like working on this viz
because when your data contains stellar-theory-contradictingly large values, no
one can really tell you that (1) you are thinking small, or (2) you have a data
accuracy problem.
Notice that this viz is quite simple. The lesson from doing this viz is in the
simple and elegant design and not about using fancy functions or filters. If you think your viz has already conveyed a
story to the audience (in this case, the awesome vastness of the universe), you
should stop right there. No need
to embellish it with other features when the charts themselves tell the story
sufficiently.
In addition, I can’t help it but visualizing and looking at
bubble charts can be quite exhilarating.
Most. Fun. Ever.
Let me know what you think.
No comments:
Post a Comment