Tableau has this Knowledge Base article on how to adjust a
date field for Daylight Saving Time (DST).However, after further testing, I
found the formulas have some bugs.
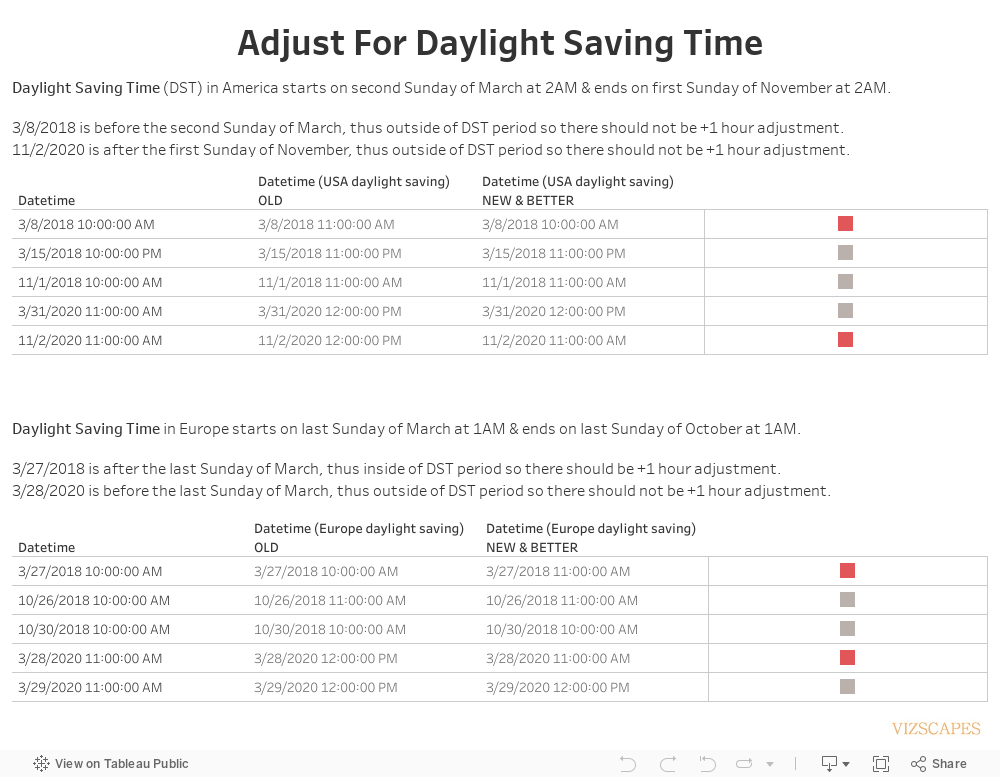
Above are test scenarios for Daylight Saving Time
adjustments in America and Europe.The
Datetime ‘OLD’ column used the (incorrect) calculated field from the KB
article, whereas the Datetime ‘NEW & BETTER’ column used the
(correct) calculated field below.Notice
the datetimes with red dot are the ones with discrepancies in the time
adjustment.
Here’s the correct calculated field to adjust for DST in the
USA:
And here’s the correct calculated field to adjust for DST in
Europe:
This post describes how to make the conditional color based on either the first or second column which will set the colors for all other columns in the same row. To achieve this result, we’ll need to use the PREVIOUS_VALUE and LOOKUP functions in a calculated field.
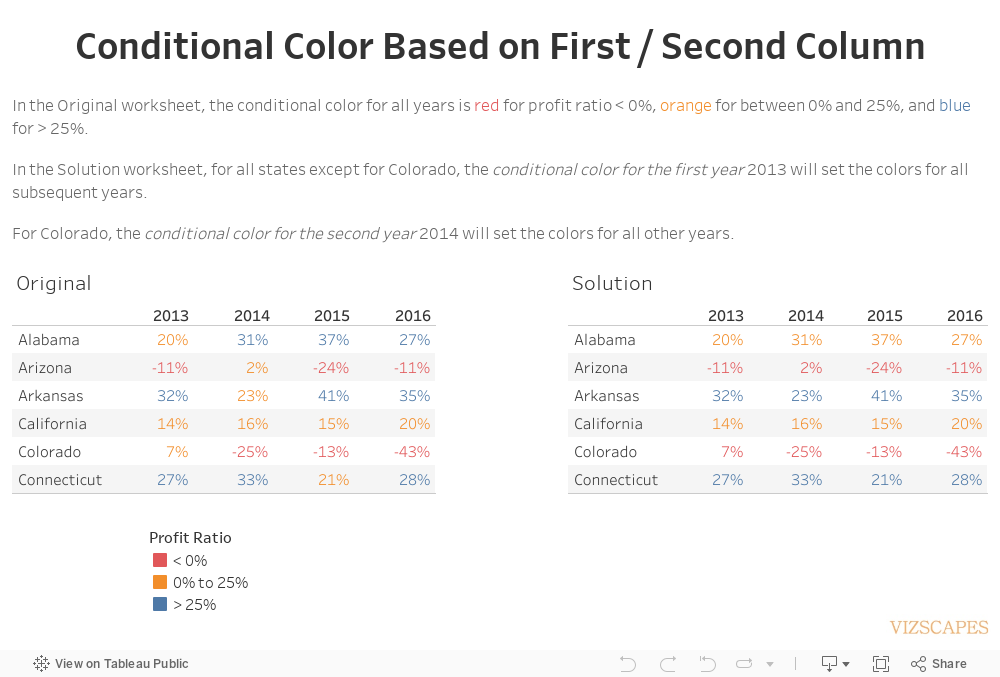
In the Original worksheet,the conditional color for all years is red for profit ratio < 0%, orange for between 0% and 25%, and blue for > 25%.
Requirement: for all states except for Colorado, the conditional color for the first year 2013 should set the color for all subsequent years. But for Colorado, the conditional color for the second year 2014 should set the color for all other years.
In the Solution worksheet, the conditional color is set by this calculated field:
// For Colorado, conditional color is set by 2014 which is the second column.
IF attr([State])='Colorado' and attr(year([Order Date])) = 2014 THEN
(if [Profit Ratio] < 0 then '< 0%'
ELSEIF [Profit Ratio] >= 0 and [Profit Ratio] < 0.25 then '0% to 25%'
ELSE '> 25%'
END)
// Since conditional color for Colorado is set by 2014 in the second column, then for 2013 use LOOKUP function to take profit ratio // for 2014 to set the conditional color.
ELSEIF attr([State])='Colorado' and attr(year([Order Date])) = 2013 THEN (
IF LOOKUP([Profit Ratio],1) < 0 then '< 0%'
ELSEIF LOOKUP([Profit Ratio],1) >= 0 and LOOKUP([Profit Ratio],1) < 0.25 then '0% to 25%'
ELSE '> 25%'
END)
// For all other states except Colorado, conditional color is set by 2013 which is the first column.
ELSEIF (attr([State])<> 'Colorado' AND ATTR(year([Order Date])) = 2013) THEN
(if [Profit Ratio] < 0 then '< 0%'
ELSEIF [Profit Ratio] >= 0 and [Profit Ratio] < 0.25 then '0% to 25%'
ELSE '> 25%'
END)
// Use previous value to set conditional color for subsequent years.
ELSE PREVIOUS_VALUE(" ")
END
So for Alabama, profit ratio for 2013 is 20% which should be orange, so all subsequent years are orange.For Arizona, profit ratio for 2013 is -11% which should be red, so all subsequent years are red, and so forth. But for Colorado, profit ratio for 2014 is -25% which should be red, so all other years are red as well.