Data: The data set has 50 articles with the number of views per each article.
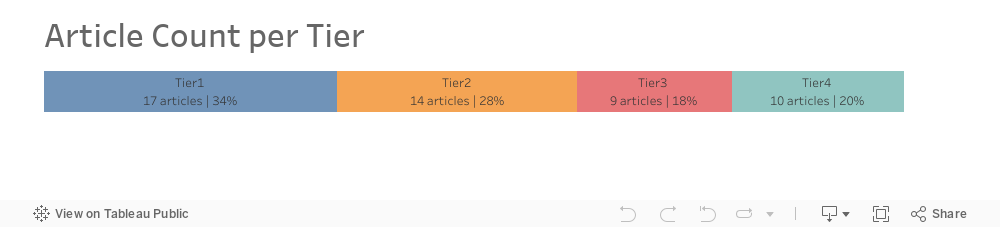
Requirement: Create a bar chart with 4 tiers that shows how many articles per tier based on number of views. Also, assign a score to each tier.
This post will explain how to use the RANK_PERCENTILE function in Tableau Prep to create different tiers and assign a score for each record based on what tier the record belongs to. The RANK_PERCENTILE function returns the percentile rank for the current row in the partition.
Here’re the steps:
1) Use aggregation to count # of articles per each view.

2) Create a Rank Percentile formula based on Views.
@Rank Percentile
{ORDERBY [Views] ASC: RANK_PERCENTILE() }
3) Create a ‘Tier Label’ formula based on 4 tiers.
Tier1: 0% - 25%, Tier2: >25% - 50%, Tier3: >50% - 75%, and Tier4: >75% - 100%.
@Tier Label
if [Rank Percentile] <= 0.25 then 'Tier1'
elseif [Rank Percentile] > 0.25 and [Rank Percentile] <= 0.5 then 'Tier2'
elseif [Rank Percentile] > 0.5 and [Rank Percentile] <= 0.75 then 'Tier3'
else 'Tier4'
end
4) Join back to the original data set based on Views so that each article will have Tier Label.

5) Create a 'View Score' formula to assign a score based on tier label.
@View Score
CASE [Tier Label]
When 'Tier1' then 1
When 'Tier2' then 2
When 'Tier3' then 3
When 'Tier4' then 4
END