July 29, 2016
July 8, 2016
Encryption Products
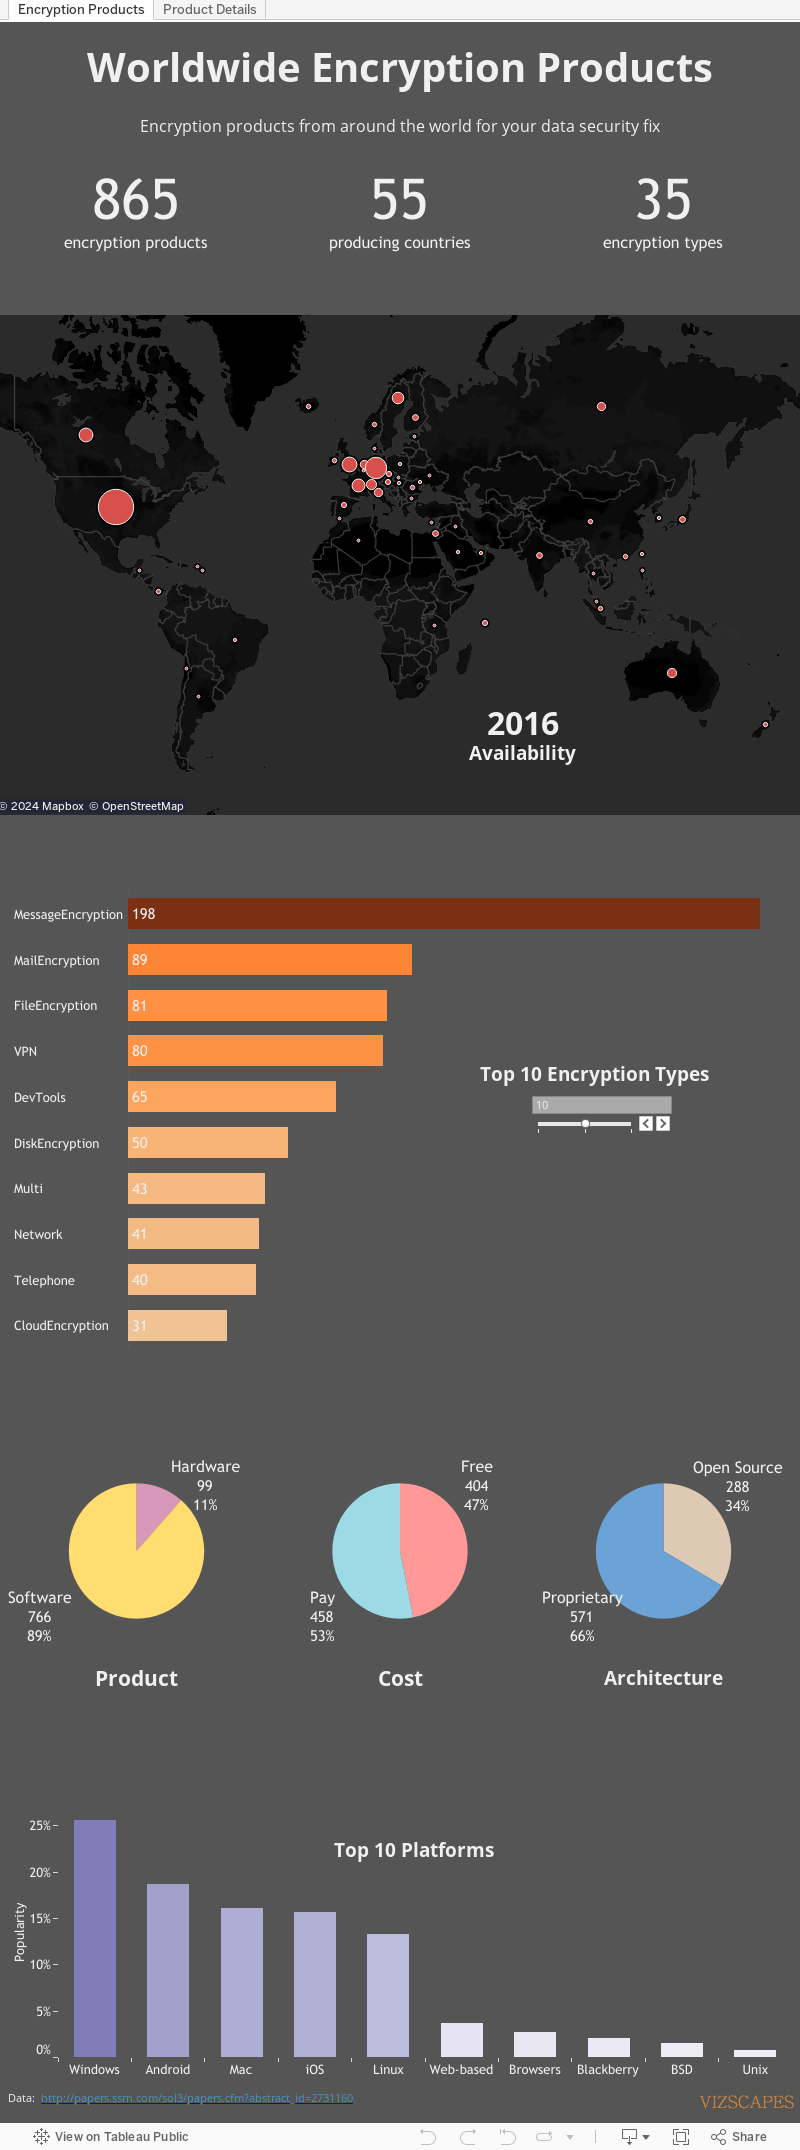
In February 2016, Professor Bruce Schneier and his team at the Berkman Center for Internet & Society at Harvard University released A Worldwide Survey of Encryption Products report that lists a whole array of encryption solutions available. These varied products, whether proprietary or open-source, for sale or free, software or hardware, are designed to combat the growing data security problem.
This visualization showcases that report data.
June 17, 2016

May 27, 2016
Homeless Veterans
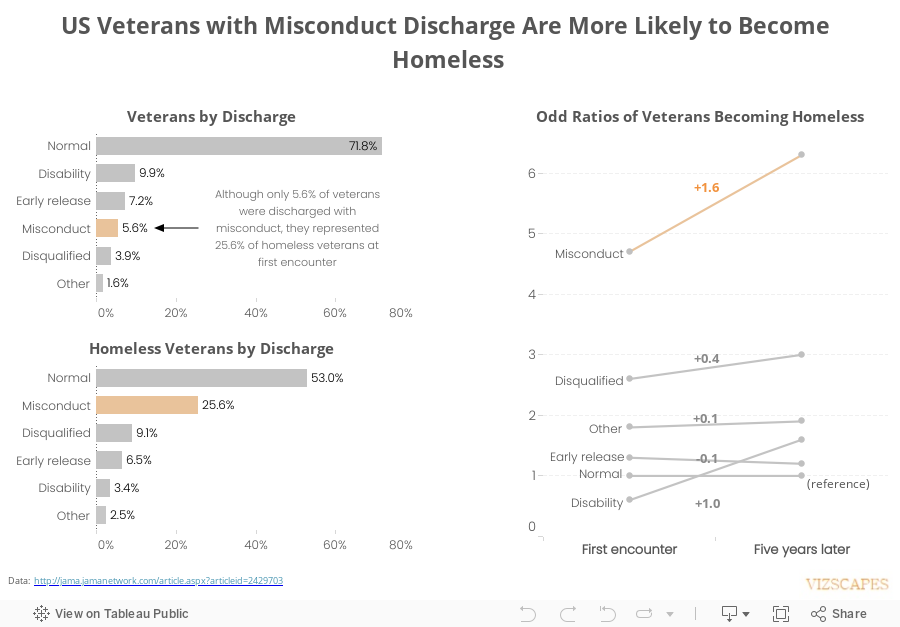
Idea for this visualization came from this article about the plight of US veterans with misconduct discharge. The article mentions about the research that shows US veterans returning from Afghanistan and Iraq with general misconduct discharge have highest risk of becoming homeless, comparing to other discharge categories.
This study is significant because it highlights the contradiction between the reality where the number of US soldiers discharged with misconduct is increasing and the federal government priority to end homelessness among veterans! Let’s hope the federal policy will be amended to match the reality so that the veterans can receive some help.
(Some of you might wonder if the veterans who were discharged with misconduct deserve to have benefits from the government as other veterans? Maybe or maybe not. But if the question were rephrased as “Do veterans who were deployed multiple times and served in combat but were discharged with misconduct deserve to have benefits from the government as other veterans?”, would that change your opinion?)
May 6, 2016
How To Create Action Filter on Worksheet with Top N Parameter
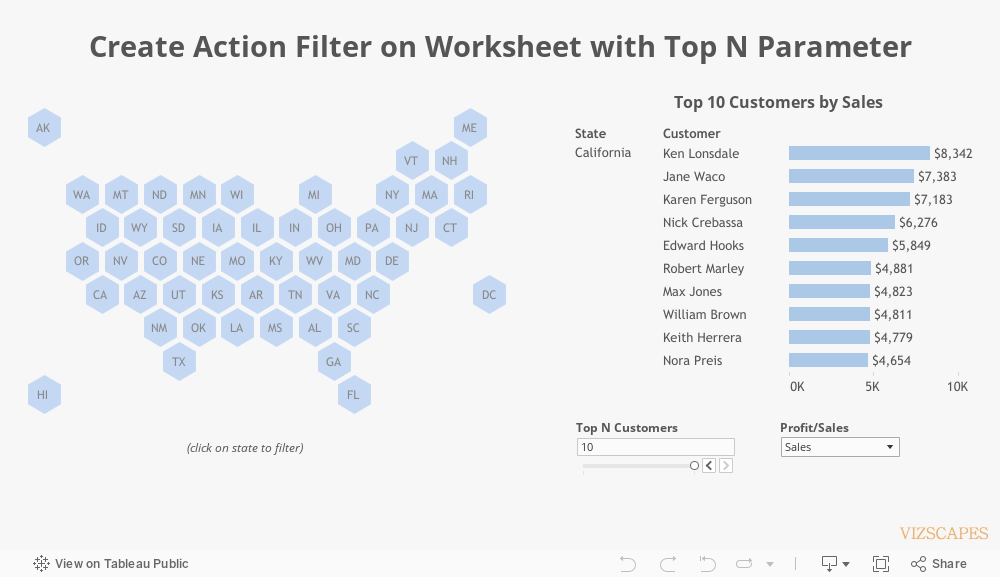
I’m pleased to present the inaugural post of a ‘How To’ series, with the intention to share the endless Tableau tricks and tips. This post will explain the nuances of how to create an action filter on a worksheet where there’s a top N parameter.
For reference on how to filter for top and top N, please review this excellent video from Tableau that shows how INDEX() function is used for ranking. However, in the video, top N is selected as a fixed number.
To take this one step further where top N is a parameter, I used Superstore data to create this visualization. Here’re the steps:
1) Create a ‘Top N Customers’ parameter.
2) Create a calculated field ‘Rank’ using INDEX() function to rank for top N customers.
3) Create a ‘Top N Filter’ calculated field where [Rank] <= [Top N Customers] to show top N customers.
4) Drag the ‘Top N Filter’ to filter pane and select ‘True’.
5) Click on ‘Edit Table Calculation’, in ‘Compute using’, select Advanced. Move State and Customer over to Addressing pane. Under Sort, select ‘Field’ and select ‘Profit/Sales’ calculated field. Then click OK to exit ‘Advanced’ window.

6) Back in ‘Edit Table Calculation’ window, select ‘Customer’ in ‘At the level’ and ‘State’ in ‘Restarting every’. This will calculate at the customer level and restart for every state.

Since the map will be used as a filter, it’s important to make sure that every state is visible. I decided to go with the hexagonal tile map (read Matt Chambers’ post for instruction).
The last step is to create an action filter where clicking on a state will show the top N customers by profit or sales for that state.
April 15, 2016
Cyberstates 2016
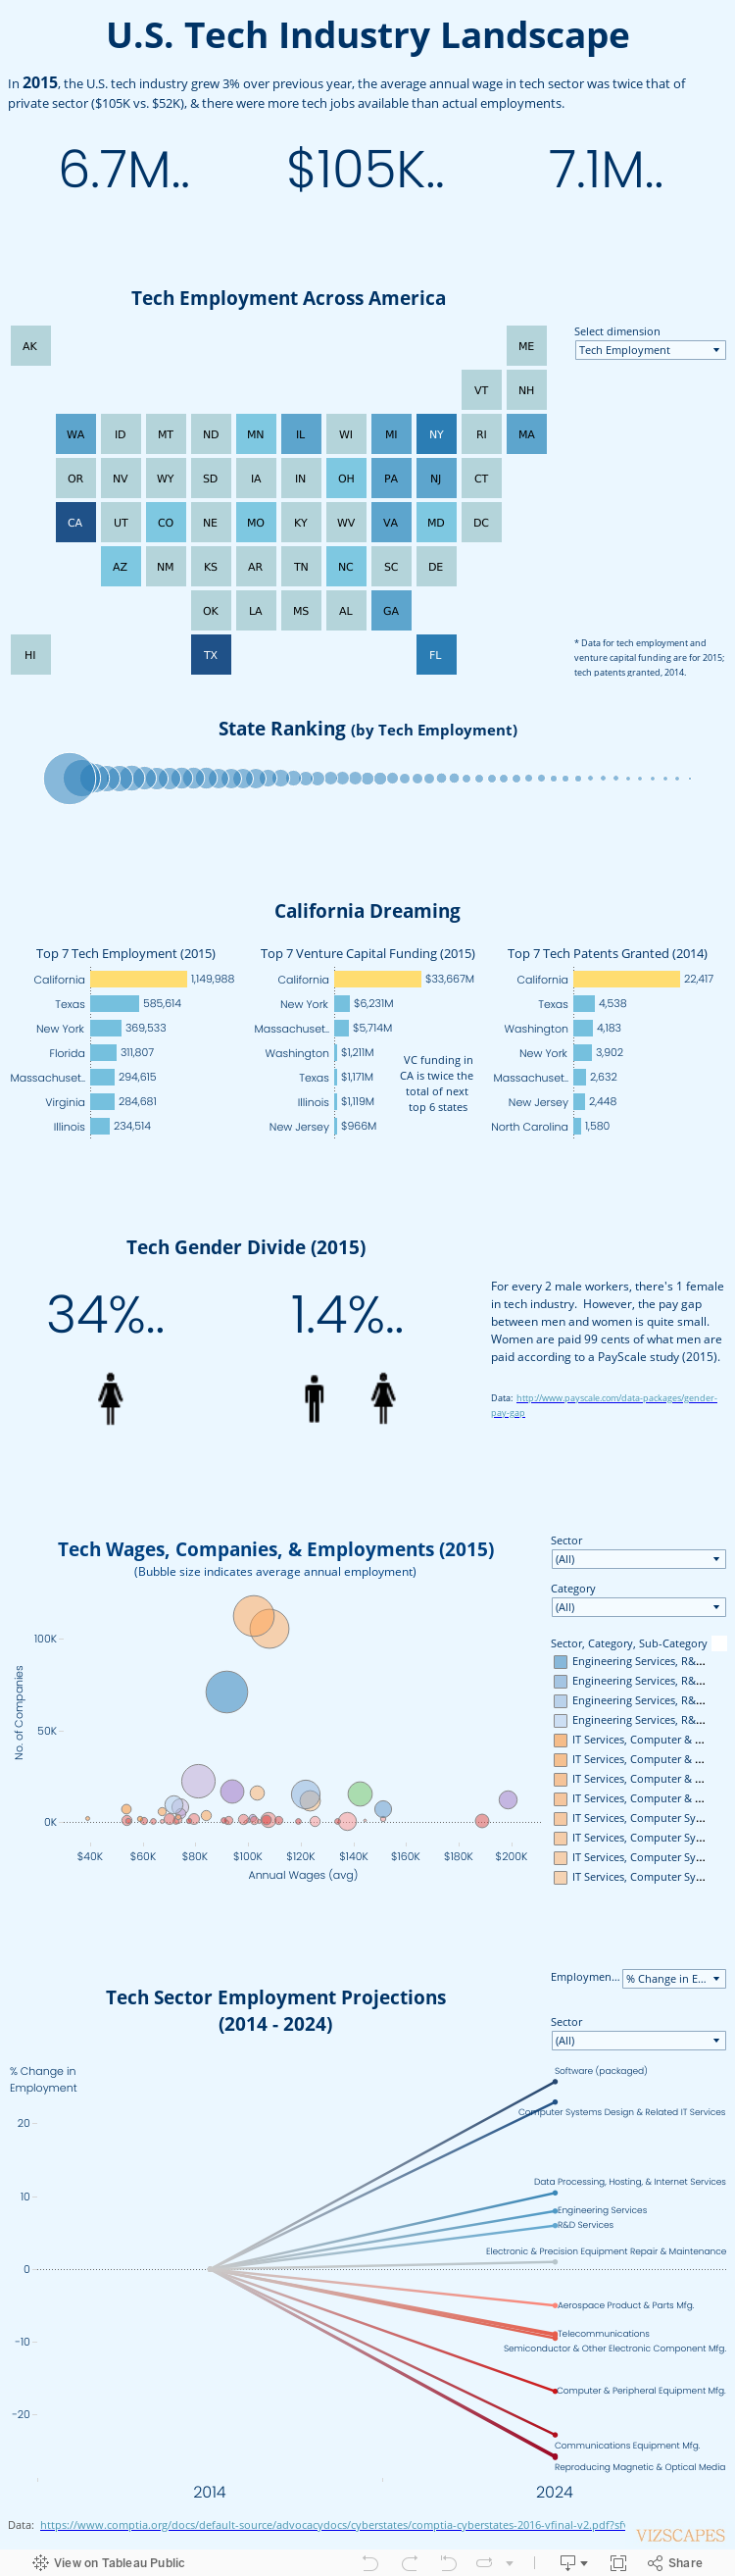
Cyberstates 2016 is
the annual report published by the Computing Technology Industry Association
(CompTIA) that provides a comprehensive look into the U.S. tech industry like
average wages, employment numbers, job postings, gender ratios, venture capital
funding, patents issued, etc.
I’m excited to present this report data as an infographic because this is my first time to design one. I love this format because it has the infographic element of quick & easy to understand and the data visualization element of interactivity. It’s a win-win!
March 25, 2016
Lebanon
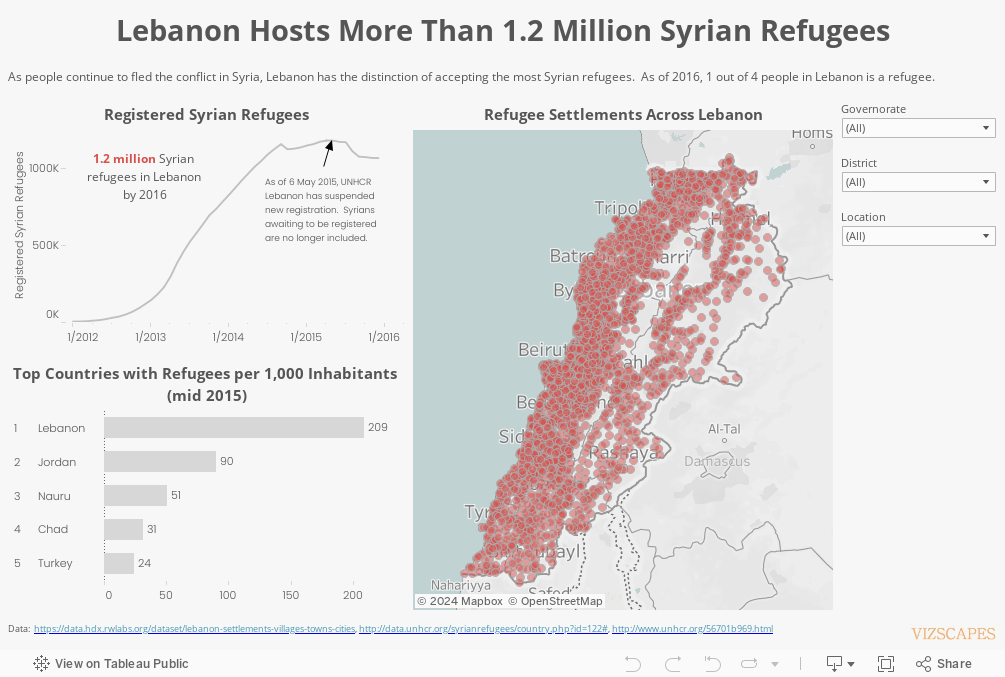
Lebanon, a country smaller than the state of Maryland, will have received more than 1.2 million Syrian refugees by 2016.
While leaders of Western European countries are debating on how to deal with the current refugee crisis, Lebanon has been quietly absorbing as many Syrian refugees as Europe has received during past year, with a quarter of the Lebanon's population now made up by refugees. In fact, the refugee numbers are so staggering, Lebanon and its people are at breaking point. Lebanon has the distinction of ranking number one worldwide in term of ‘Refugees per 1,000 inhabitants’.
Angelina Jolie, the Hollywood actress and special envoy for the UNHCR, has recently visited a refugee camp in the Bekaa Valley in Lebanon and gave an impassioned speech on the plight of the refugees. Let’s hope the world’s nations will coordinate and do more to assist and give hope to these refugees.
Subscribe to:
Posts (Atom)