May 27, 2016

May 6, 2016
How To Create Action Filter on Worksheet with Top N Parameter
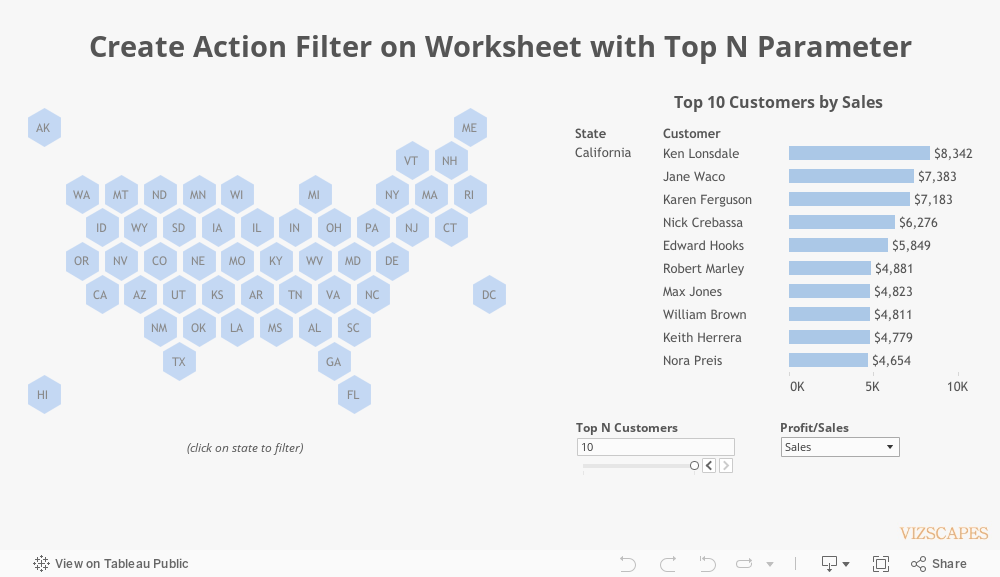
I’m pleased to present the inaugural post of a ‘How To’ series, with the intention to share the endless Tableau tricks and tips. This post will explain the nuances of how to create an action filter on a worksheet where there’s a top N parameter.
For reference on how to filter for top and top N, please review this excellent video from Tableau that shows how INDEX() function is used for ranking. However, in the video, top N is selected as a fixed number.
To take this one step further where top N is a parameter, I used Superstore data to create this visualization. Here’re the steps:
1) Create a ‘Top N Customers’ parameter.
2) Create a calculated field ‘Rank’ using INDEX() function to rank for top N customers.
3) Create a ‘Top N Filter’ calculated field where [Rank] <= [Top N Customers] to show top N customers.
4) Drag the ‘Top N Filter’ to filter pane and select ‘True’.
5) Click on ‘Edit Table Calculation’, in ‘Compute using’, select Advanced. Move State and Customer over to Addressing pane. Under Sort, select ‘Field’ and select ‘Profit/Sales’ calculated field. Then click OK to exit ‘Advanced’ window.

6) Back in ‘Edit Table Calculation’ window, select ‘Customer’ in ‘At the level’ and ‘State’ in ‘Restarting every’. This will calculate at the customer level and restart for every state.

Since the map will be used as a filter, it’s important to make sure that every state is visible. I decided to go with the hexagonal tile map (read Matt Chambers’ post for instruction).
The last step is to create an action filter where clicking on a state will show the top N customers by profit or sales for that state.
April 15, 2016
Cyberstates 2016
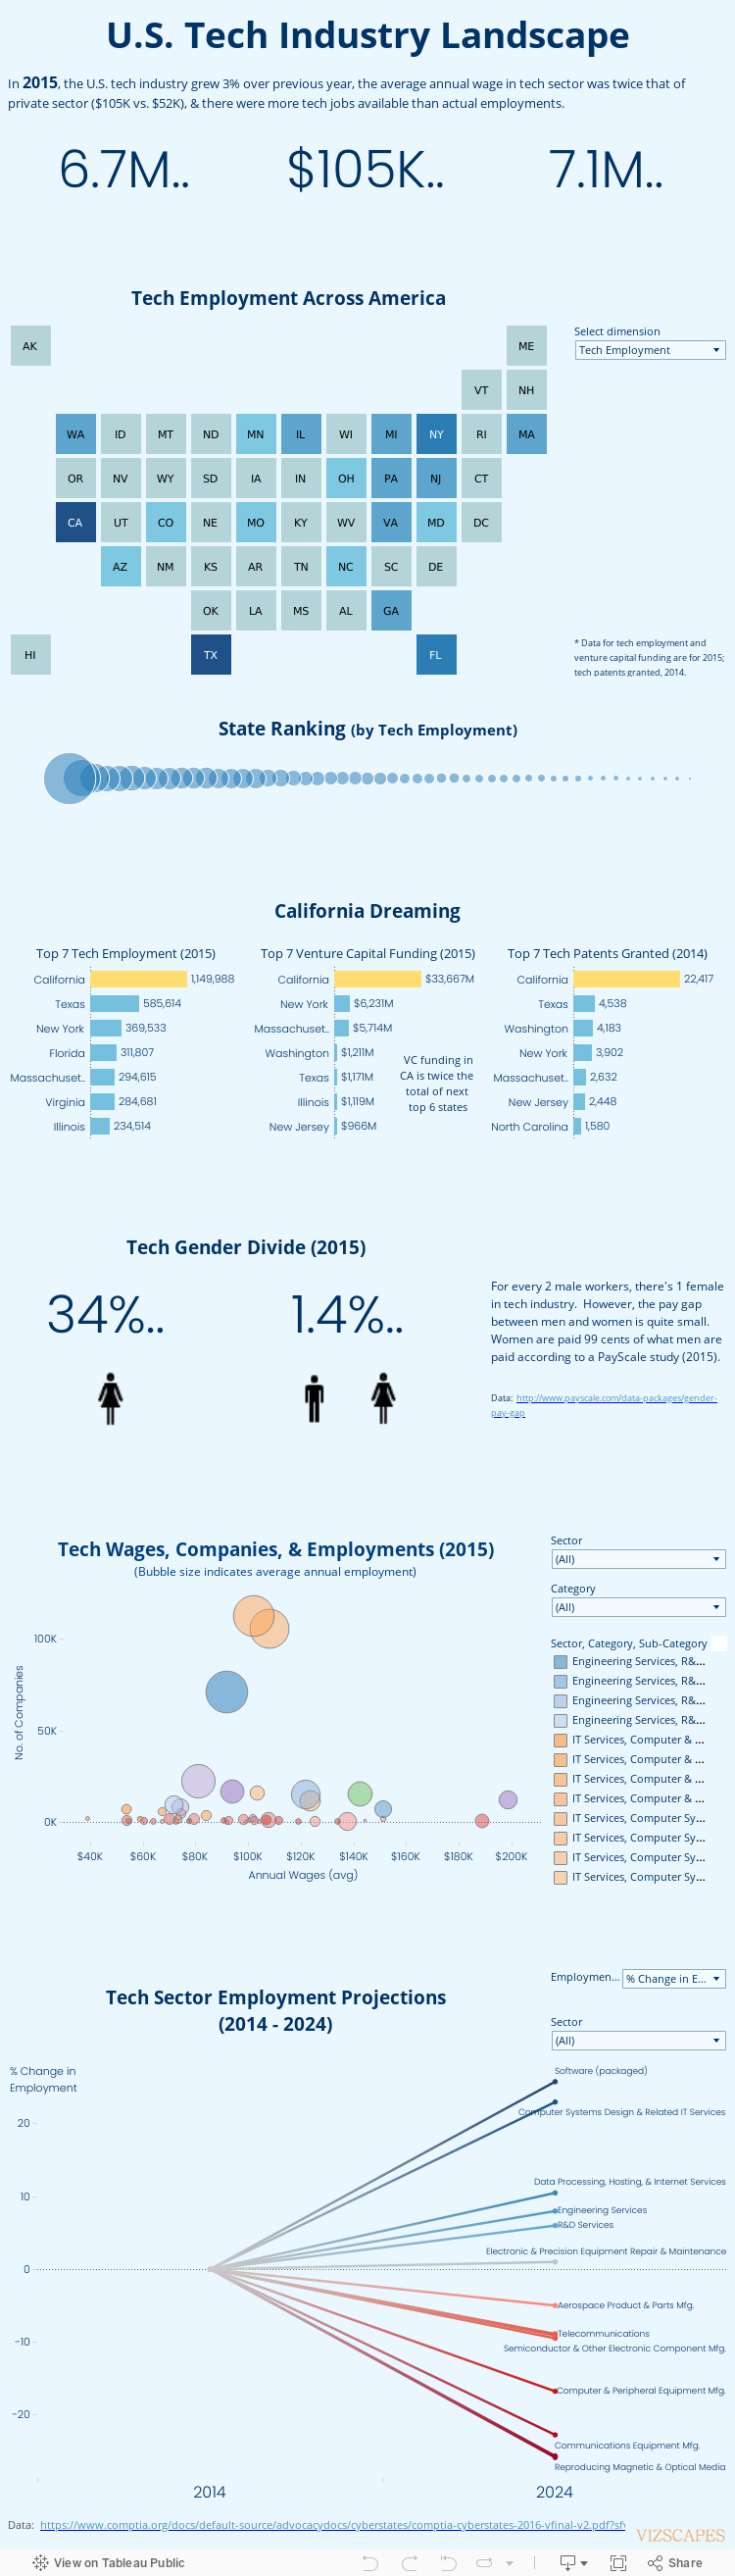
Cyberstates 2016 is
the annual report published by the Computing Technology Industry Association
(CompTIA) that provides a comprehensive look into the U.S. tech industry like
average wages, employment numbers, job postings, gender ratios, venture capital
funding, patents issued, etc.
I’m excited to present this report data as an infographic because this is my first time to design one. I love this format because it has the infographic element of quick & easy to understand and the data visualization element of interactivity. It’s a win-win!
March 25, 2016
Lebanon
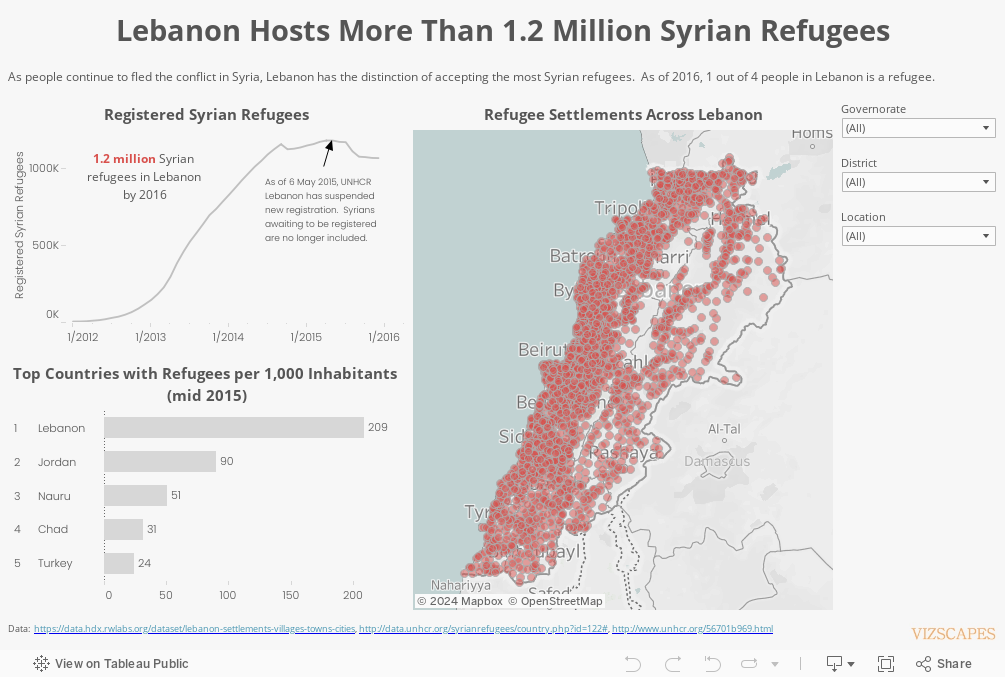
Lebanon, a country smaller than the state of Maryland, will have received more than 1.2 million Syrian refugees by 2016.
While leaders of Western European countries are debating on how to deal with the current refugee crisis, Lebanon has been quietly absorbing as many Syrian refugees as Europe has received during past year, with a quarter of the Lebanon's population now made up by refugees. In fact, the refugee numbers are so staggering, Lebanon and its people are at breaking point. Lebanon has the distinction of ranking number one worldwide in term of ‘Refugees per 1,000 inhabitants’.
Angelina Jolie, the Hollywood actress and special envoy for the UNHCR, has recently visited a refugee camp in the Bekaa Valley in Lebanon and gave an impassioned speech on the plight of the refugees. Let’s hope the world’s nations will coordinate and do more to assist and give hope to these refugees.
March 4, 2016
Transatlantic Trends (4)
In this last installment of Transatlantic Trends visualization, we’ll look into what Americans and Europeans think about Russia’s role in world affair. More Americans think it’s desirable that Russia exerts strong leadership in global affairs, but even more Greeks think so. On the other hand, more Spaniards and Polish don’t think that Russia should exert strong power (understandably for Poland because of its proximity and history of conflict with Russia, but Spain...?)
Who has the most favorable opinion of Russia? The patriotic Russians, of course, as well as the Greeks (why do the Greeks like Russia so much?). Who disapproves the way their country is managing relations with Russia? The Spaniards and Polish, who seem not to favor Russia very much.
February 12, 2016
Transatlantic Trends (3)
In this visualization, the European Union (EU) is evaluated by its own people where Europeans voiced their opinions on whether their EU membership has been a good or bad decision.
And the results are the Europeans like (1) EU allows freedom of travel, work, & study within its borders and (2) EU is a community of democracies. However, they dislike the fact that EU membership has harmed their country’s economy (especially the Italians, Portuguese, and Spaniards).
Turkey, not yet an EU member, has majority of its people consistently saying over the years that they don’t have a favorable opinion of the EU and that they don’t want to see EU exert strong leadership in world affairs. The United Kingdom, where exit from the EU is a political aim and desire of some people, don’t have a favorable opinion of the EU either.
January 22, 2016
Transatlantic Trends (2)
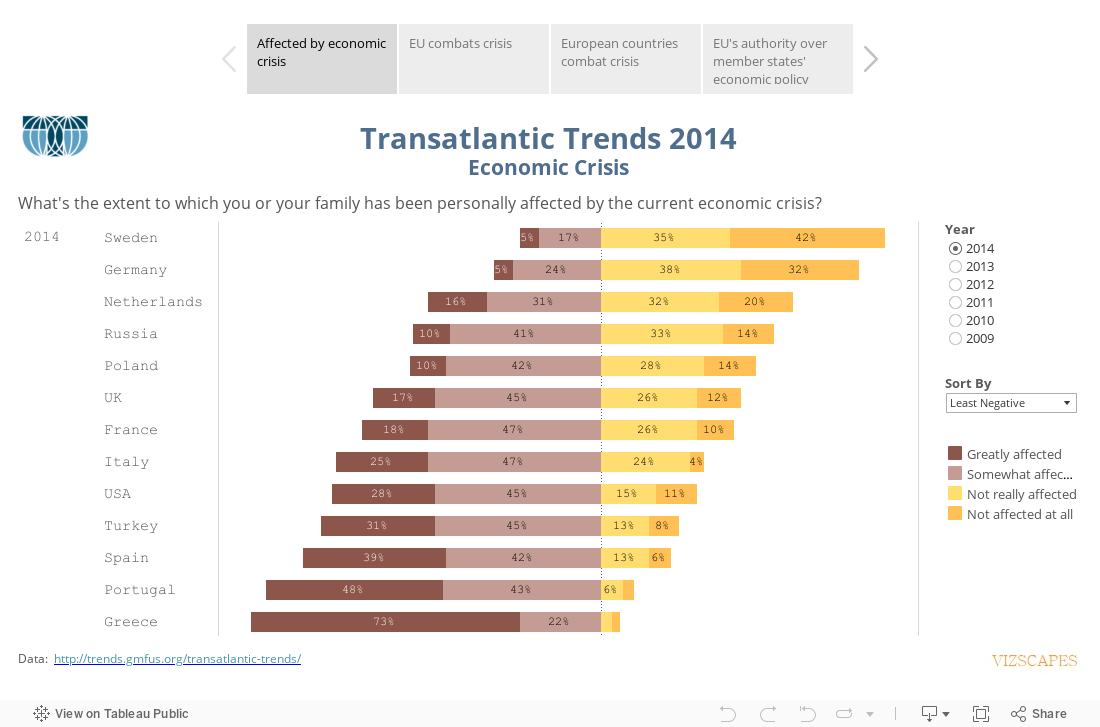
This post will expand on the previous post of the global-thematic Transatlantic Trends report, that the economy and unemployment were two most important issues on people’s mind. The visualization analyzes how people were affected by the global economic crisis from 2009-2014.
The Greeks, Portuguese, Spaniards, Turkish, and Americans revealed that they were most affected by the economic crisis, whereas for the least affected Swedes & Germans, what crisis?
The Italians and Spaniards thought that the European Union (EU) was not responsive to combating the economic crisis and that the countries affected by the economic crisis were not doing enough to combat the crisis. In other words, help us!
In every surveyed EU country, majority of people thought that each country should retain their authority over their country’s economic and budgetary policies, with the Greeks, British, & Swedes displayed the strongest feeling about this issue. In short, dear EU, thanks for your financial help, but no thanks to your authority!
Subscribe to:
Posts (Atom)