September 11, 2015

9/11 Memorial


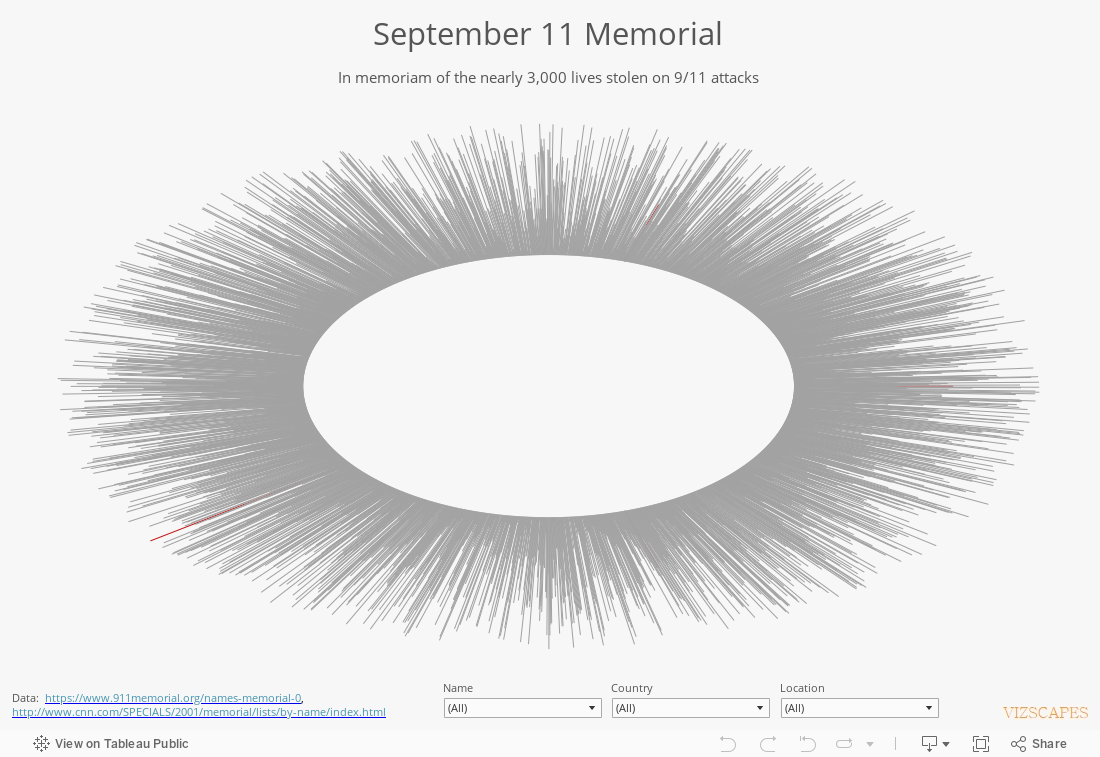
A contemplative visualization to remember the nearly 3,000 lives perished on September 11, 2001 attacks at the World Trade Center site, near Shanksville, Pennsylvania, and at the Pentagon. 


At the center of this visualization is an empty space that mimics the National 9/11 Memorial design. The blank space embodies the feeling of loss and absence from the taking of thousands of lives on that pivotal day.  The single lines around the central void represent the lives stolen.  Each line is like a candle and by hovering over the line the name will appear, which is like lighting a candle in honor of their life and their memory. 


There are five red lines that personify the five youngest victims age from 2 to 8.  This color selection is inspired by the moving image of the little girl in the red coat in the movie Schindler’s List.  Like the girl in the red coat that represents the innocence of the Jews being slaughtered in the movie, the red lines in the visualization highlight the innocence not only of the youngest victims but also of the nearly 3,000 men and women lost in the 9/11 attacks.


This visualization is influenced by the work of Dave Hart.


August 14, 2015

Design Matters


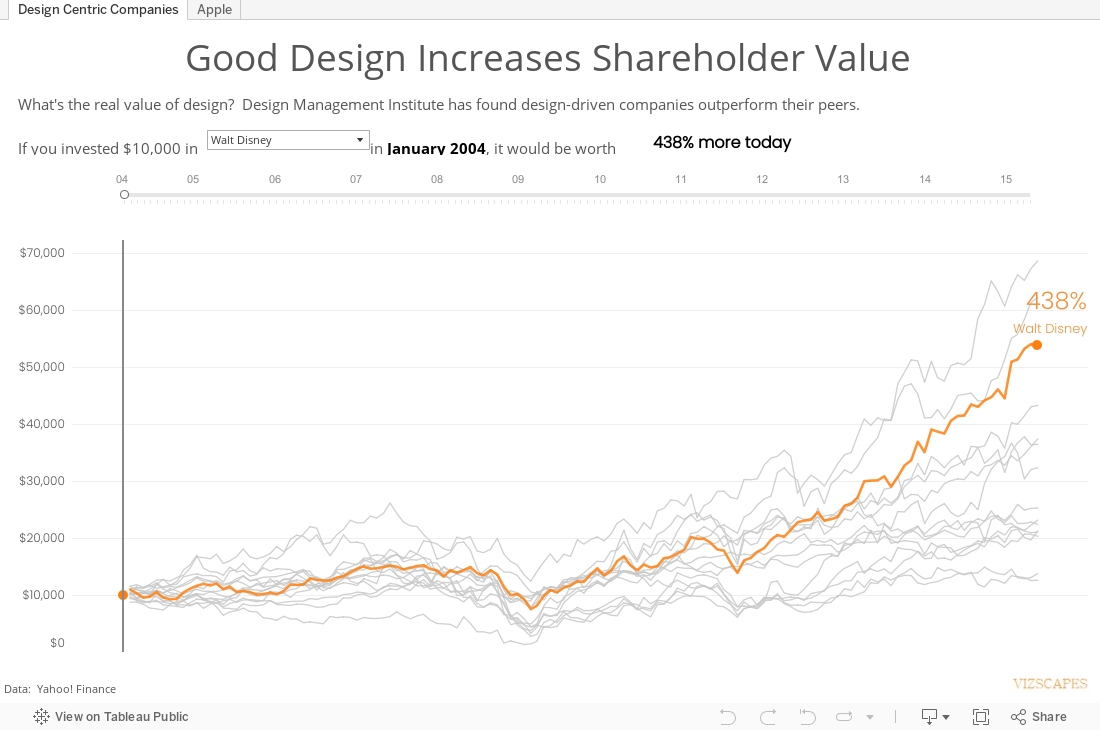
The Design Management Institute (in partnership with Motiv Strategies) has found that companies that integrate design into their products or services consistently produce strong financial return.  Here’re the performances of sixteen design-driven companies that together make up the Design Value Index. 


Apple which has integrated exceptional user-experience design into all its products produces spectacular stock return.  Apple’s astounding performance is in a category by itself literally because including Apple with other companies in the same chart would simply destroy the curve.


A big thanks to Tableau Zen Master Kelly Martin for her work that laid the foundation for this viz.


July 17, 2015

Hyperloop


Sonic-speed land transportation study in a stunning report with superb graphics & visualizations.  From California with love and welcome to the future.  (Click image to download report).


May 22, 2015

Product Water Footprint


The Water Footprint Network based in the Netherlands is a non-profit foundation that connects with communities and partners interested in sustainable use of fresh water.   The organization believes that sustainable use of fresh water is a critical foundation for healthy lives and a healthy planet.  


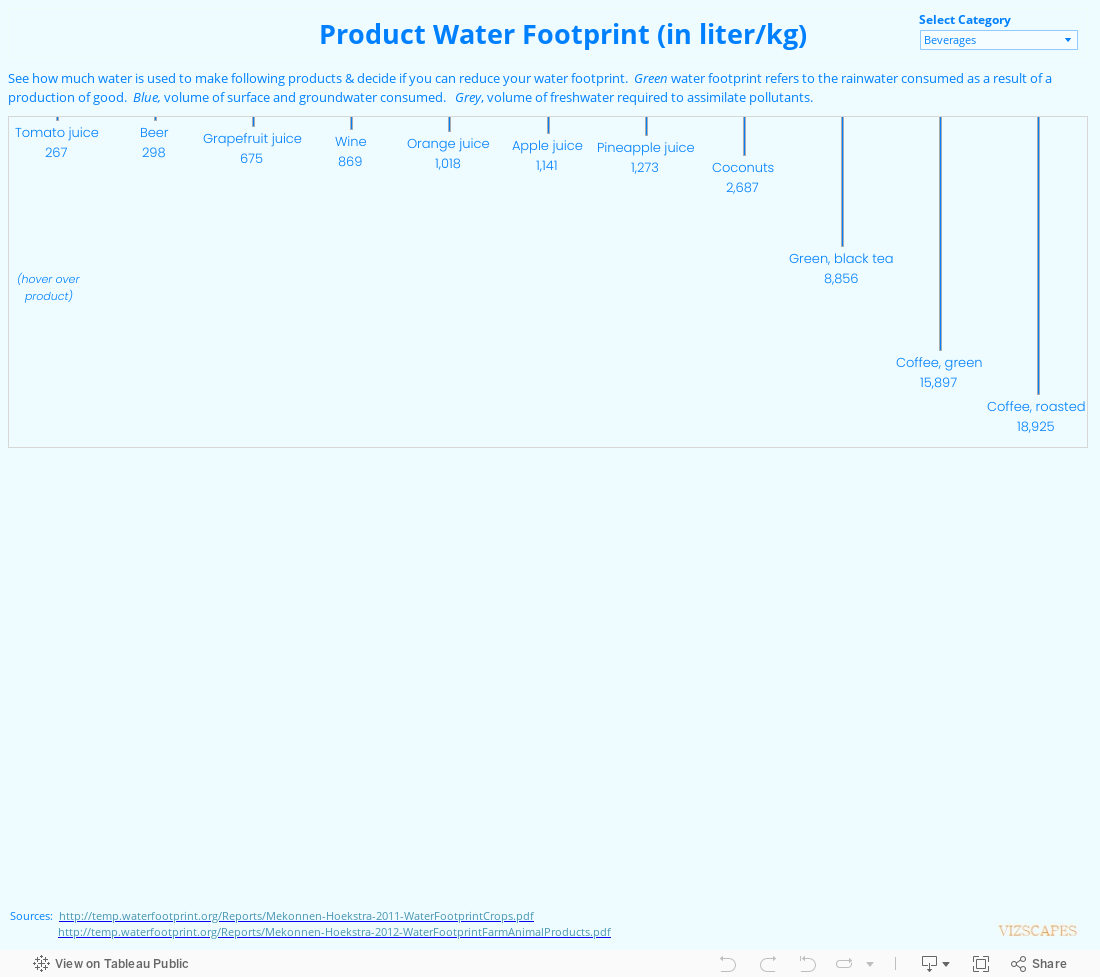
The Water Footprint Network employs the water footprint as a method to measure how much water was used to produce each of the goods or services we consume.  The water footprint looks at both direct and indirect water use of a product and includes water consumption and pollution through the full production cycle.


There are 3 types of water footprint:


     1)  Green water footprint:  water from rain or precipitation.  It is relevant for agricultural, horticultural and forestry products.


     2)  Blue water footprint:   water from surface or groundwater.  It is relevant for irrigated agriculture, industry and domestic water use.


     3)  Grey water footprint:  amount of fresh water required to assimilate pollutants to meet specific water quality standards.


Let’s take a look at the water footprint for agricultural and farm animal products and determine if you can do your part to reduce your water footprint.  Remember every drop counts!


April 24, 2015

Global Risks


Picture this:  Every January.  Davos.  World Economic Forum. 


Most people would envision an exclusive gathering of the world’s movers and shakers, some might see a big collection of private jets, but since I’m a data analyst the only thing I can think of is… lots of data.  And I’m not disappointed.


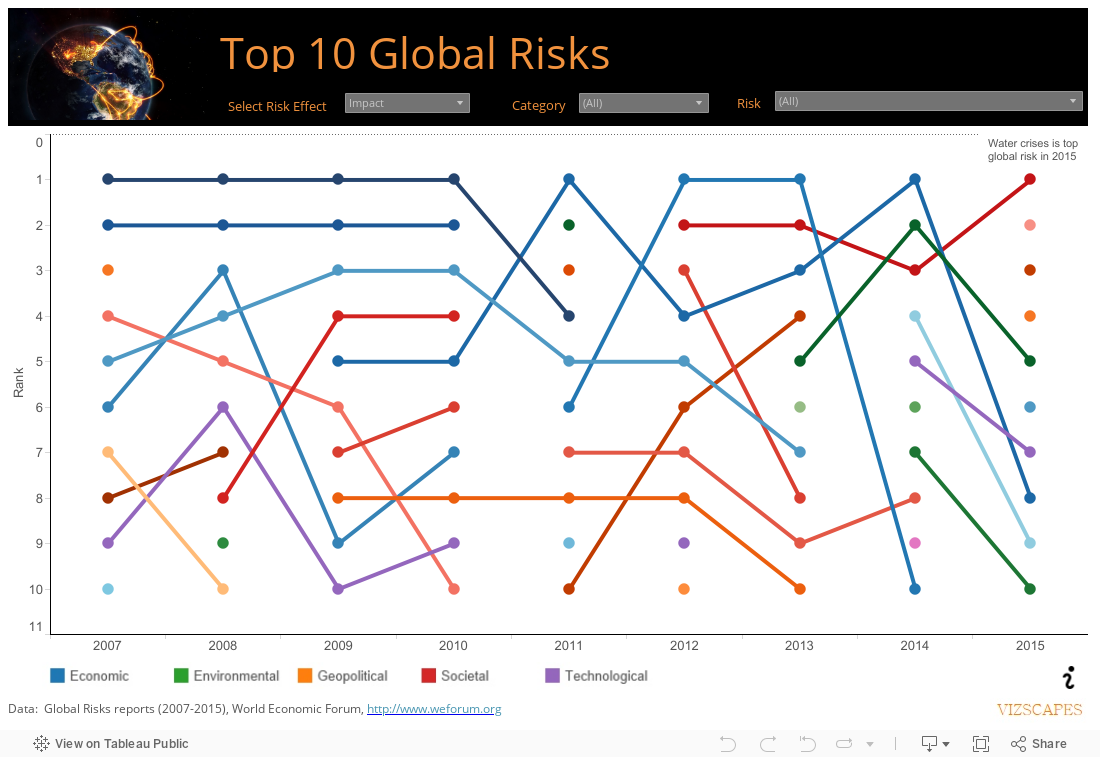
Since 2006, the World Economic Forum has published the annual Global Risks report which identifies risks that might cause significant negative impact for several countries and industries.  A key characteristic of global risks is their potential systemic nature to affect an entire system, as opposed to individual parts and components.


The risks can be viewed in terms of the financial impact they might cause or the probable likelihood they might occur.  The risks are also grouped into five categories:  (1) Economic, (2) Environmental, (3) Geopolitical, (4) Societal, & (5) Technological. 


The data was visualized as a bump chart.  The viz reveals that economic risk dominated from 2007 to 2014, such as asset-price bubble as top risk (during the Global Financial Crisis 2007-2009) and fiscal crises as a result of constrained fiscal finances (immediate post-crisis years 2010-2014).


In 2015, societal and geopolitical risks emerge as top risks with water crises (prolonged drought), spread of infectious diseases (Ebola in West Africa), and interstate conflict (rise of Islamic State) occupying the top five risks.  Also in 2015, water crises becomes the number 1 global risk in terms of impact and its category is changed from environmental to societal to reflect its potential enormous effect to social stability.


April 3, 2015

Eigentaste's Funniest Jokes

Eigentaste is a collaborative filtering algorithm to elicit real-valued user ratings on a common set of items and applies principal component analysis (PCA) to the resulting dense subset of the ratings matrix (Technical talk).


Eigentaste is a technology to deliver personalized jokes catered to your own taste, imagine that!  (Marketing talk).

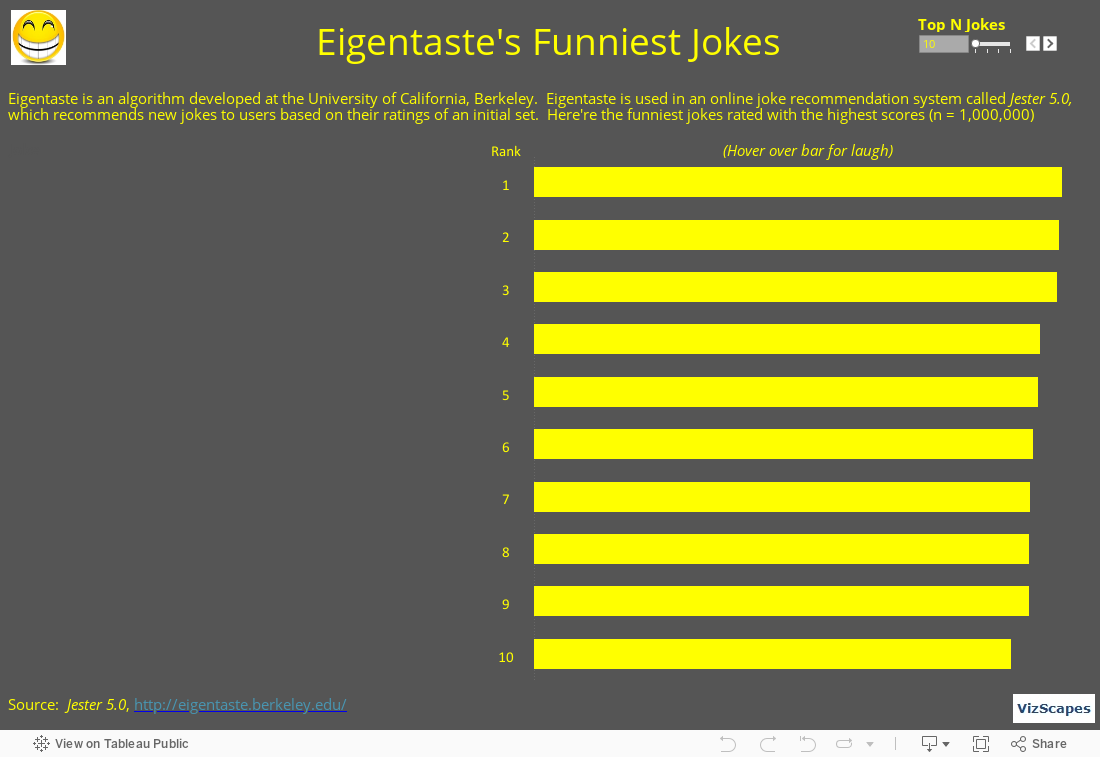
Eigentaste was developed by Professor Ken Goldberg and his team at the University of California, Berkeley.  The technology has been implemented in Jester 5.0, an online joke system, to recommend new jokes to users based on their ratings of the initial set.  Here’re the funniest jokes from Jester 5.0 based on users’ highest rating.  


Laugh more, live longer!