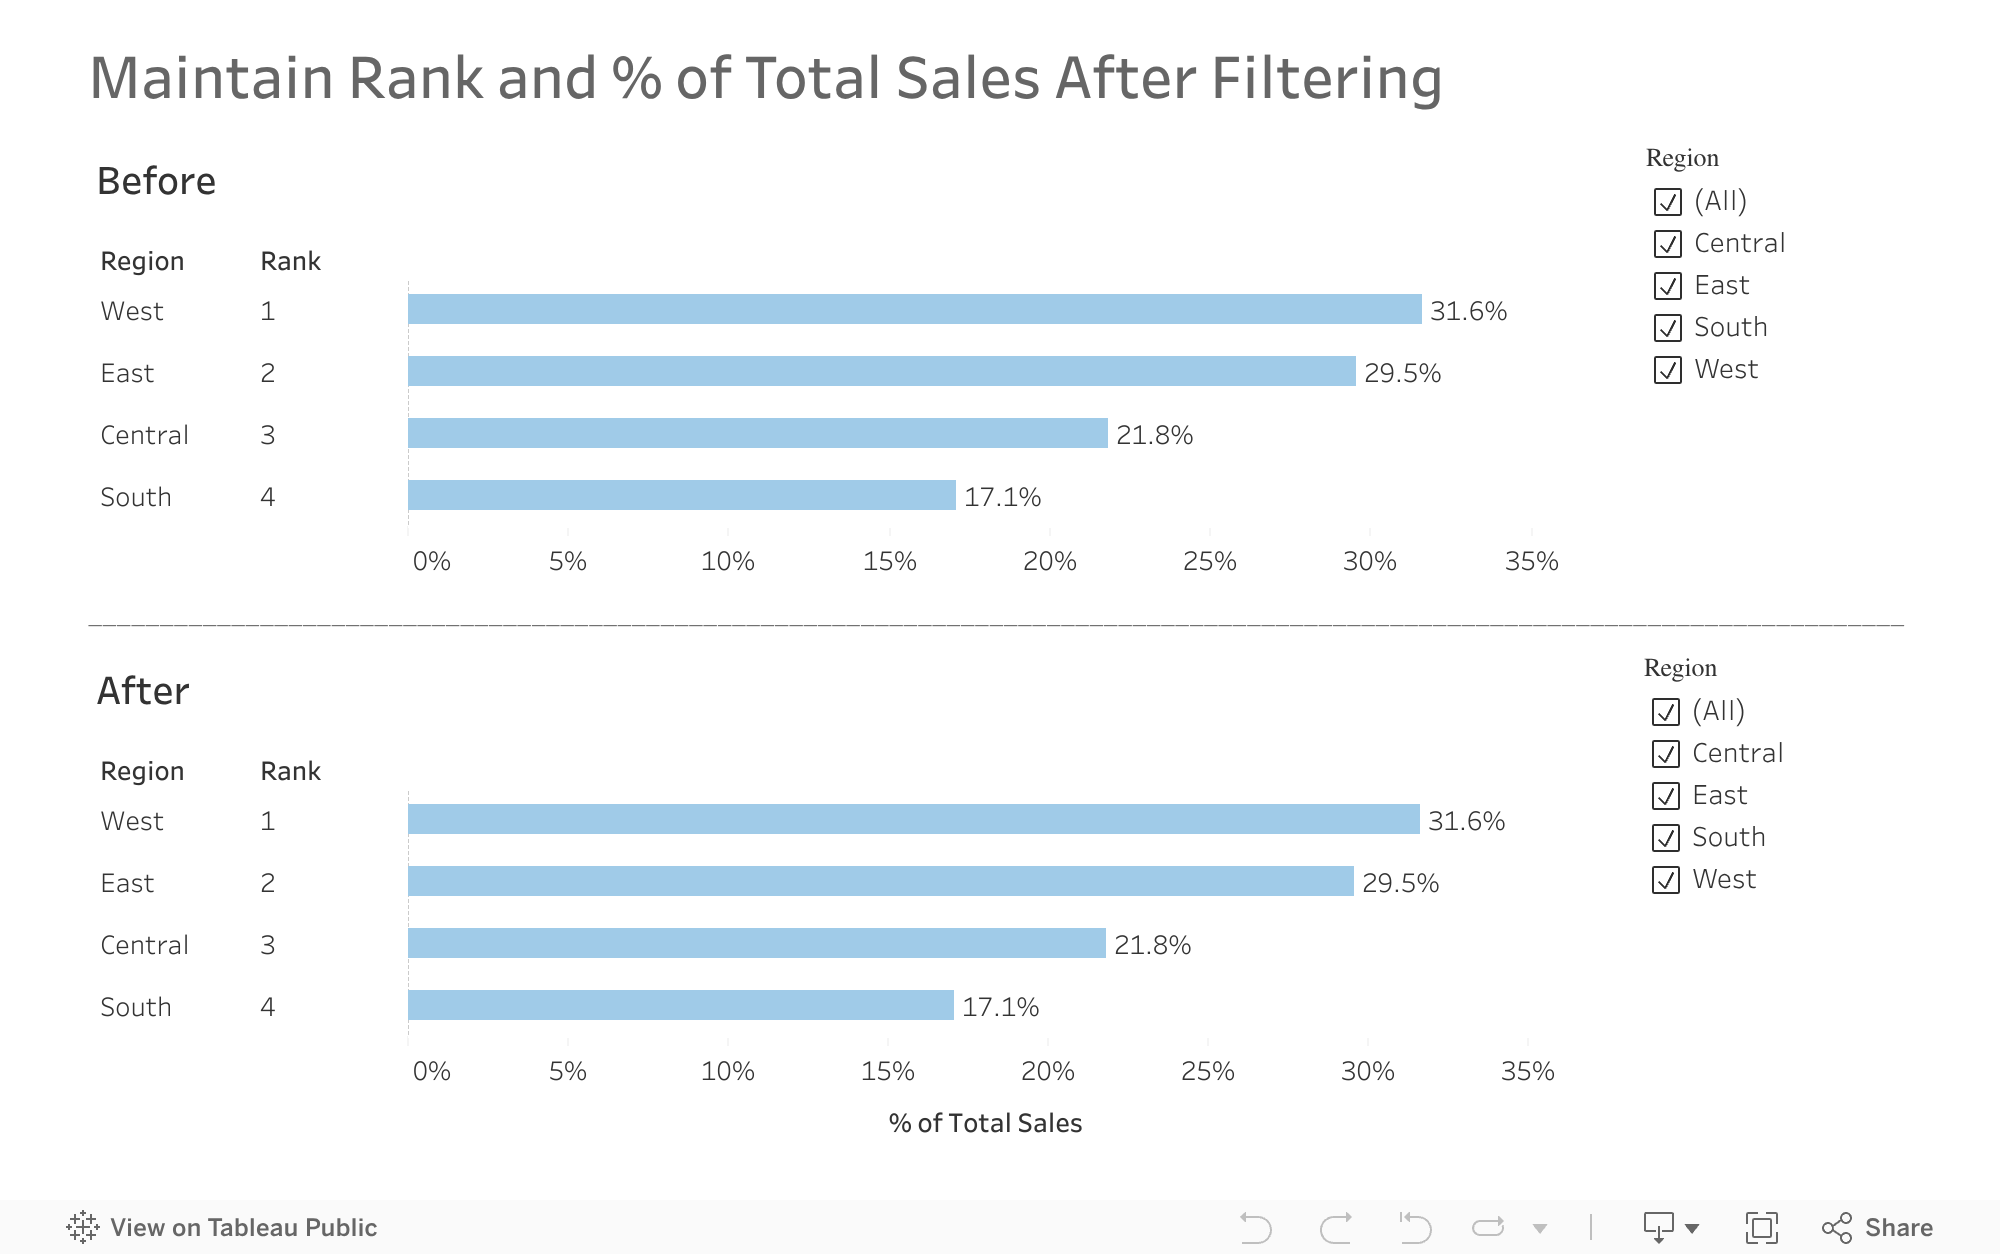
Business Request: In the bar chart, keep the rank and the % of total sales the same after filtering for specific region.
Solution:
1) To keep rank the same after filtering for Region, use the tip from this video:
a) Create a formula ‘Region Filter’ with WINDOW_MIN function.
@Region Filter
WINDOW_MIN(ATTR(Region))
b) Pull @Region Filter to the Filters pane and click ‘OK’ button.
c) Click on down arrow in the ‘Region Filter’ and select Compute Using ‘Cell’.
d) Select ‘Use all’ and then click ‘OK’ button.
e) Use ‘Region Filter’ as filter.
2) To keep the % of sales the same after filtering for Region, use the tip from this article:
a) Create a formula ‘% of Total Sales’ using FIXED LOD. The reason is FIXED LOD precedes dimension filter in Tableau order of operation. This will ensure that when the Region filter is applied, the % of total sales is maintained because FIXED LOD precedes dimension filter.
@% of Total Sales
SUM(Sales) / AVG( { SUM(Sales) } )
b) Use formula @% of Total Sales to create the bar chart.
Good luck everyone!