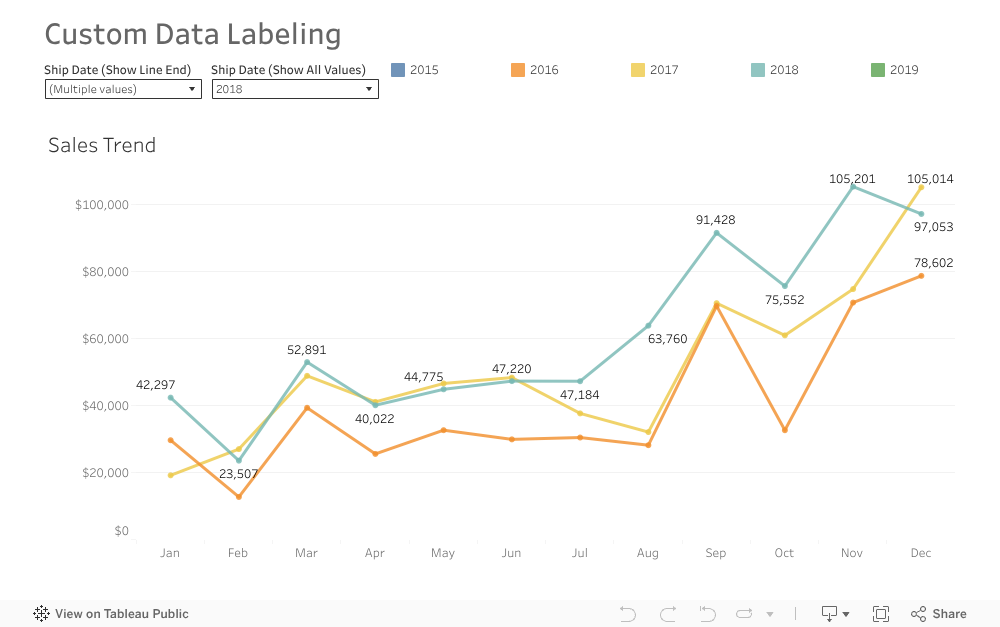
Business Request: Customize data labeling where users can dynamically select what years to display value at line end and what years to display value for every month on line charts.
Solution: We will use set selection and dual axis to customize the data labeling.
1) Create a set for Year of Ship Date that will display values by line end in line chart (@Ship Date To Show Line End Set).
2) Create another set for Year of Ship Date that will display values for every month in line chart (@Ship Date To Show All Values Set).
3) Create formulas to calculate for sales based on each set.
@ Sales (Line End)
If [Ship Date To Show Line End Set] then [Sales] end
@ Sales (All Values)
If [Ship Date To Show All Values Set] then [Sales] end
4) Use these 2 formulas to create a dual-axis line chart.
5) Show sets for users to select years to display value at line end and to select years to display value for every month on line charts.
Many thanks to Jim Dehner for help with the solution.